
We’re going to approach this topic taking the mainstream view of the existence of SARS-CoV-2, its ability to cause COVID-19 and so on at face value. We’re going to do that to be able to look objectively at the subsequent evidence for the vaccine effectiveness (VE) with respect to the COVID-19 vaccines that are currently either mandated in some places around the world, and coerced pretty much everywhere else without the need to repeatedly add in caveats so this is simpler to read.
So don’t take any of this article as an indicator or evidence for or against the existence of SARS-CoV-2 etc, this is all about looking at the evidence that the “vaccines” are working, or not working, based on official data, mainstream science publications and other perhaps unexpected sources.
There is evidence now coming from various Government and mainstream scientific outlets to support what many medical professionals, scientists and intelligent researchers were saying before these “vaccines” were even publicly available, which is they will damage the recipient’s immune system, possibly permanently.
The very simple metric that should indisputably demonstrate a vaccine’s effectiveness is all-cause mortality should perceptibly and statistically significantly drop. In other words, at any point a medical intervention is made for any reason related to “saving lives”, there should be a reduction in the number of deaths. We can forget the whole “died with or of COVID”, or anything about underlying causes, comorbidities or anything else for the purposes of this analysis. If a medical intervention is supposed to save lives, then less people should die, it’s that simple. If mortality drops, then there is a correlation between the intervention and the reduction of mortality and there is at least a chance the intervention helped. Of course there could be other confounding factors that might need to be ruled out or considered but if mortality does not drop, or indeed rises and there are no other obvious causes outside the thing the intervention was intended to address, then there is no possible case to be made that the intervention helped.
With that basic principle in mind, we can now look at a few official statistics to make a reasonably reliable determination of VE (vaccine effectiveness).
The UK Office for National Statistics (ONS) recently produced a spreadsheet document called “Omicron Predictors of Positivity” in which they have published some figures they describe in the document…
Today we have published some early results from the Coronavirus (COVID-19) Infection Survey showing the characteristics of people more likely to be infected with the Omicron variant compared with the Delta variant. These early results are based only on the first fortnight’s data that have sufficient cases for analysis on the Omicron variant, so caution is advised. Fuller analysis based on more data from our survey will be published when available.
https://www.ons.gov.uk/file?uri=/peoplepopulationandcommunity/healthandsocialcare/conditionsanddiseases/adhocs/14107coronaviruscovid19infectionsurveyukcharacteristicsrelatedtohavinganomicroncompatibleresultinthosewhotestpositiveforcovid19/omicronpredictorsofpositivityadhoc.xlsx
Our reason for looking at this sort of thing is because of “caution”. It was understood by the cautious that getting injected with something that hasn’t completed all the usual safety trials, no long-term data, produced (allegedly) within a year by companies with track records of criminal activity that would make the mafia blush might not be the best idea, especially as the threat it was claiming to protect us from was minimal unless you were at huge risks from all kinds of illnesses that already exist. It is almost amusing to see the ONS, like the Governments, add these phrases into the documents containing problematic (for them) data almost as if to say “yes, this is the data but please don’t pay too much attention to it, if any”.
So, the data then. They have a table on the tab in the spreadsheet titled “1B” that contains the following:
| Screening characteristic | Category | Estimated likelihood of testing positive for COVID-19 with an Omicron probable result (odds ratio) |
|---|---|---|
| Vaccination status | Not vaccinated (Reference) | 1 |
| Vaccination status | 1 dose | 1.57 |
| Vaccination status | 2 doses, more than 14 days ago | 2.26 |
| Vaccination status | 3 doses, more than 14 days ago | 4.45 |
The table in the spreadsheet does contain other columns of data, things like CI (Confidence Interval) numbers and sample sizes, statistical reference stuff, but for the purposes of looking at the figures we’re interested in, the table above contains the relevant information. Obviously you can look at the other data if you want to in the file linked above.
These figures are based on ONS mathematical models, and a note in the spreadsheet explains that…
In addition to the variables in the table above, this model controls for age, region, sex, ethnicity, deprivation, household size, multi-generational household, and urban/rural classification.
To understand what those numbers in the table mean, the document also explains…
The odds ratios in this table indicate the likelihood of an individual testing positive for COVID-19 with an Omicron probable result given a particular characteristic/variable. When a characteristic/variable has an odds ratio of one, this means there is neither an increase nor a decrease in the likelihood of testing positive for COVID-19 with an Omicron probable result compared with the reference category. An odds ratio greater than one indicates an increased likelihood of testing positive for COVID-19 with an Omicron probable result compared with the reference category. An odds ratio less than one indicates a decreased likelihood of testing positive for COVID-19 with an Omicron probable result compared with the reference category.
So the reference category is the unvaccinated. The “odds ratio” is 1 for the unvaccinated reference category. If the vaccines were going to improve your chances of not testing positive for the Omicron variant of COVID-19, then the odds ratio for any of the vaccinated groups, those being one, two or three injections should be less than 1. They are not. As you can see, the more vaccines you’ve had, the higher the odds of testing positive for Omicron.
1 vaccine = 1.57 times higher chance
2 vaccines = 2.26 times higher chance
3 vaccines = 4.45 times higher chance
Accepting the caveats the ONS add to their figures, this is still not what anyone expected to see, based on the belief in what the Government and their paid “experts” have been telling everyone. “Get Boosted Now” was the mantra, and was chanted like a spell by all and sundry including Boris Johnson as the best defence against Omicron. That was obviously, and still is (as they’re still saying it) a blatant lie.
But there are more figures, and there is more evidence to support the idea that these “vaccines” are actually having a negative effect on mortality. We’ll look at a few more now.
We can look at figures from Germany for example. Here you can see the numbers for current excess mortality in Germany. Here you can see the deviation from the median for the years 2016 to 2020 of those numbers. They are interactive graphs on those pages and you can hover over each week to see the numbers.
If we look at weeks 36 to 43 and compare between 2021 and the median 2016 to 2020 number, it shows the excess mortality in these absolute figures. In some of those weeks there were approximately 2,000 deaths more than the median from 2016 to 2020.
Using data from the German Destatist Federal Office and the Robert Koch Institute it is possible to calculate the number of deaths in each of the 16 German federal states for weeks 36 to 40 for each year from 2016 to 2021. It is then possible to average the number of deaths for each state for the years 2016 to 2020, and then compare that running average to 2021 and correlate those numbers with figures for the number of double-vaccinated.
Calculating a ratio of the number of deaths in 2021 weeks 36 to 40 per state compared to the average from 2016 to 2020 per state for the same weeks, and then plotting those ratios against figures for double-vaccinated per state shows that the higher the proportion of double-vaccinated, the higher the ratio of excess deaths, ranging from around 2% higher to 15% higher.
As registered COVID-19 deaths make up only a tiny proportion of those deaths as recorded by the Robert Koch Institute, they cannot explain the excess mortality, up in 2021 from the average of the same time in 2016 to 2020. Again we are seeing official figures that are good indicators that the “vaccines” are not doing the job they were advertised to do. They are meant to be saving lives, and yet we are seeing excess deaths over and above the alleged COVID-19 death numbers. Why? If the vaccines were simply “waning” in their effectiveness they should have no impact, and the excess death figures should match the official COVID death numbers. They don’t. Why?
There is also this pre-print (i.e. not peer reviewed yet) study on the Medrxiv website titled “Vaccine effectiveness against SARS-CoV-2 infection with the Omicron or Delta variants following a two-dose or booster BNT162b2 or mRNA-1273 vaccination series: A Danish cohort study”. As it is not peer reviewed it can and should be considered as such, but there are some interesting aspects to it.
These graphs are from the study…
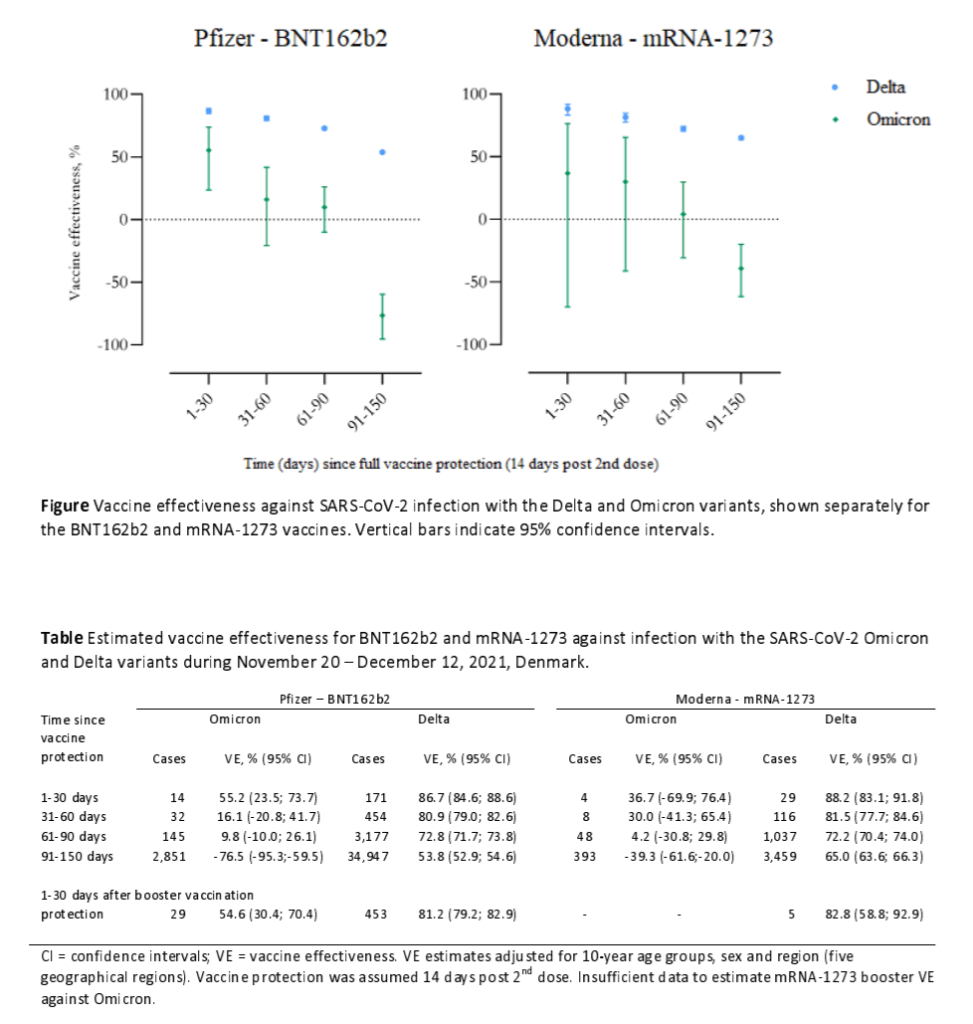
A negative VE (vaccine effectiveness) figure means the vaccine is not helping you, it is hurting your immune system. According to that dataset for Pfizer vs Omicron, after 60 days the VE is only 9.8% and for Moderna vs Omicron after 60 days it is 4.2%. This is clearly not the 95% or even 100% protection we were all told by politicians, media and the pharmaceutical companies themselves. It gets worse as after 90 days the VE drops to -76.5% for Pfizer and -39.3% for Moderna. Not just barely effective, but actually negatively effective.
Naturally there is a rush to “debunk” such figures as impossible. Absurd statements like “there’s no such thing as negative vaccine effectiveness” are among the responses to this paper. No responses are actually attacking the data with facts, or contraindicating data though. Let’s be clear, this paper is not coming from any kind of vaccine sceptics or COVID denier camps. But these numbers do appear to match up with people’s lived experiences of the multi-jabbed being generally more ill recently than the unjabbed, plus the other facts and figures that all appear to indicate the same thing, which is more jabs means worse health outcomes.
Then there is this study on the Medrxiv website titled “The BNT162b2 mRNA vaccine against SARS-CoV-2 reprograms both adaptive and innate immune responses”. Yes, these mRNA injections are damaging people’s immune systems including the innate immune system we are all born with. Again, this study holds the completely mainstream view on SARS-CoV-2 etc. and is not seeking to challenge the official narrative, apart from what the evidence is showing regarding these “vaccines”.
The adaptive immune system is the part that learns as we go along, the bit with antibodies plus B and T cells. There is also the innate immune system made up of dendritic cells, macrophages, basophils, neutrophils, granulocytes etc. that defend us from the moment we are born. Put simply, in the study they found that mRNA injections are able to alter the responses of adaptive and innate immune responses, and not for the better. At the end of the summary they state:
…the BNT162b2 vaccine also modulated the production of inflammatory cytokines by innate immune cells upon stimulation with both specific (SARS-CoV-2) and non-specific (viral, fungal and bacterial) stimuli. The response of innate immune cells to TLR4 and TLR7/8 ligands was lower after BNT162b2 vaccination, while fungi-induced cytokine responses were stronger. In conclusion, the mRNA BNT162b2 vaccine induces complex functional reprogramming of innate immune responses, which should be considered in the development and use of this new class of vaccines.
https://www.medrxiv.org/content/10.1101/2021.05.03.21256520v1.full-text
And here’s the thing, the “complex functional reprogramming of innate immune responses” WAS considered, but only by good, honest doctors and scientists who were then censored and called “anti-vaxxers”. The very people that SHOUD have considered it, the various regulatory and advisory committees and organisations like the CDC and FDA in the United States, the MHRA, JVCI and SAGE in the UK and all the others in countries around the world that rubber-stamped this garbage, that we have been told to trust or lose our jobs, ability to socialise etc… they just ignored it.
To get a fuller review of the details of this study and lots of info regarding adaptive and innate immunity I recommend reading this article by Jessica Rose.
When you hear various experts and especially politicians and media discuss the effects of these “vaccines” and what protection they allegedly offer, they always talk about antibody levels and responses, exclusively. They talk as if antibodies are the only aspect of our immune systems which is simply not true.
Next, there is this study titled “Worldwide Bayesian Causal Impact Analysis of Vaccine Administration on Deaths and Cases Associated with COVID-19: A BigData Analysis of 145 Countries”. The main findings of this study are that…
One manner to respond to this question can begin by implementing a Bayesian causal analysis comparing both pre- and post-treatment periods. This study analyzed publicly available COVID-19 data from OWID (Hannah Ritchie and Roser 2020) utlizing the R package CausalImpact (Brodersen et al 2015) to determine the causal effect of the administration of vaccines on two dependent variables that have been measured cumulatively throughout the pandemic: total deaths per million (y1) and total cases per million (y2). After eliminating all results from countries with p > 0.05, there were 128 countries for y1 and 103 countries for y2 to analyze in this fashion, comprising 145 unique countries in total (avg. p < 0.004).
Results indicate that the treatment (vaccine administration) has a strong and statistically significant propensity to causally increase the values in either y1 or y2 over and above what would have been expected with no treatment. y1 showed an increase/decrease ratio of (+115/-13), which means 89.84% of statistically significant countries showed an increase in total deaths per million associated with COVID-19 due directly to the causal impact of treatment initiation. y2 showed an increase/decrease ratio of (+105/-16) which means 86.78% of statistically significant countries showed an increase in total cases per million of COVID-19 due directly to the causal impact of treatment initiation. Causal impacts of the treatment on y1 ranges from -19% to +19015% with an average causal impact of +463.13%. Causal impacts of the treatment on y2 ranges from -46% to +12240% with an average causal impact of +260.88%. Hypothesis 1 Null can be rejected for a large majority of countries.
https://vector-news.github.io/editorials/CausalAnalysisReport_html.html
Put simply this study found that COVID vaccines cause more COVID cases per million (38% more in the US for example) and more deaths per million “associated” with COVID (31% more in the US for example) which is not what was advertised. Why?
Finally for this article but most definitely not the only other piece of evidence is the 40% increase in deaths between ages 18-64 as reported by an Indiana life insurance company as per this article. From the article…
“We are seeing, right now, the highest death rates we have seen in the history of this business – not just at OneAmerica,” the company’s CEO Scott Davison said during an online news conference this week. “The data is consistent across every player in that business.”
https://www.thecentersquare.com/indiana/indiana-life-insurance-ceo-says-deaths-are-up-40-among-people-ages-18-64/article_71473b12-6b1e-11ec-8641-5b2c06725e2c.html
Upticks in deaths among working aged people who have been largely under-represented in deaths attributed to COVID-19 as that has primarily been concentrated in the over-70s pretty much everywhere is alarming. The UK ONS responded to a Freedom of Information request asking for the mean (the total sum of the values added together divided by the total number of values) and median (the middle value of the full ordered list of values) ages of those who’s deaths were “from” COVID-19 or “involved” COVID-19 over a 16 month period from March 2020 to June 2021. The values overall reported are:
| Median (involving COVID) |
Mean (involving COVID) |
Median (due to COVID) |
Mean (due to COVID) |
|
|---|---|---|---|---|
| All People | 82 | 79.9 | 82 | 80 |
| Males | 81 | 78.3 | 81 | 78.4 |
| Females | 84 | 81.9 | 85 | 82.1 |
link to source data
These figures are for the UK but are representative of what is the case pretty much everywhere. A 40% hike in the third and fourth quarters of 2021 of deaths in people aged 18-64 is more than a little concerning. Obviously the insurance companies are unhappy at the extra costs involved in paying out on life insurances on people they weren’t expecting to die which is why that conversation is even going on. They are not really fussed about anything else other than the impact this has on their bottom line and their plans to hike premiums to compensate.
Put all of these things together and it should raise some red flags for the most ardent vaccine enthusiast. What we are seeing are indicators that not only are these COVID-19 injections mostly unhelpful and are definitely not providing the protection they were, and still are claimed to provide, but there is significant evidence that the concerns about adversely affecting people’s general immune systems badly, not to mention all the actual adverse reactions and deaths reported, are all well-founded and this horrific experiment must stop.